The “Que”…
- “Those who fail to learn from history are doomed to repeat it.” (Quote from Winston Churchill)
Everybody born and raised in Johnstown knows the stories of all the big floods that occurred in the history of the city. Most can talk fluently about the 1889 flood and famous dam break, about snow melt and the 1936 flood, about the US Army Corp. of Engineers project to line the river walls after the 1936 flood, all the false rumors of a “Flood-Free” status as deemed upon the city after those flood control projects were completed, and of course the 1977 flood and breach of the Laurel Run Dam in Tanneryville/West Taylor Township.
Following 6 to 8 inches of rainfall on May 31st 1889 the South Fork Dam failed. Downstream of the dam, through the Little Conemaugh River Valley into Johnstown and beyond, tragically 2,209 souls of our ancestors perished as a 60 foot wall of water hit the city at a speed of 40 miles per hour. Still to this day it remains the largest loss of life in the United States from a flooding natural disaster. For more information about this famous flood and dam break, visit the following:
US National Park Service, Johnstown Flood National Memorial website at https://www.nps.gov/jofl/index.htm
Johnstown Flood Museum website at https://www.jaha.org/attractions/johnstown-flood-museum/
Engineering perspective website at https://www.geoinstitute.org/news/johnstown-flood-1889-catastrophe-civil-engineering-part-5
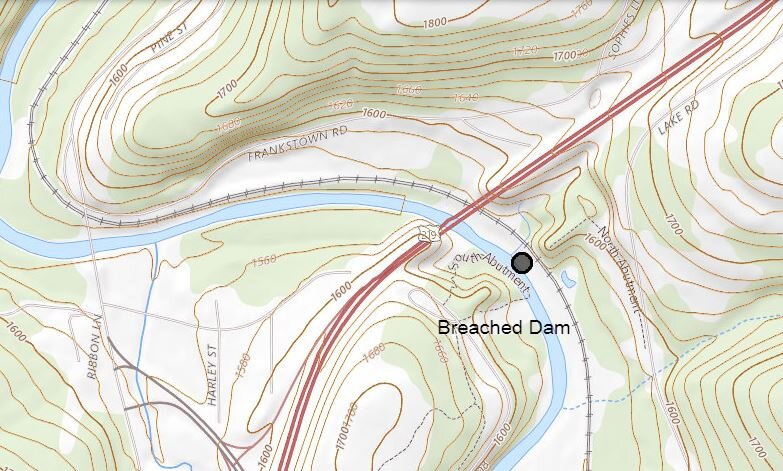
The gray dot on this map shows the location of the breached South Fork Dam along the South Fork of the Little Conemaugh River near Sidman and St. Michael. US Route 219 is the red-line which crosses the waterway just downstream of where the dam embankment used to be. (Source: USGS National Map)

The red dot on this map shows the location of the breached South Fork Dam at the same spot as the map above and to show that location relative to the City of Johnstown which was to the west and downstream. The Little Conemaugh River is in blue color and runs in a right-to-left (east to west) direction. Johnstown is labeled and is situated at the bottom left-hand corner (west) side of the map. (Source: USGS National Map)
As I have spent my entire career since college in the field of civil engineering with water resource specialty, in particular working within the fields of drainage, stormwater, stormwater management and dam safety, I wanted to remind folks of some VERY IMPORTANT information about all of this.
First of all, about National Dam Safety Awareness Day. For good reason, May 31st of each year is a day deemed by many federal, state and local agencies and dam safety organizations as National Dam Safety Awareness Day. This day righteously commemorates the lives lost due to the flood and failure of the South Fork Dam in Johnstown, Pennsylvania on May 31, 1889. For more information about the National Dam Safety Awareness Day, visit the Association of State Dam Safety Officials website at: https://www.damsafety.org/NDSAD
Secondly, about past existence of the South Fork Dam. The South Fork Dam is no longer a threat to the City of Johnstown because it is gone. It is not there. It failed in 1889 and was not rebuilt.
Thirdly, about the present Quemahoning Dam. The Quemahoning Dam (and reservoir) is there. It has been there now for over a hundred years. It is there, it is real, it exists and it matters. It is one of the largest reservoirs in the Commonwealth of Pennsylvania. It is situated on Quemahoning Creek about 10.1 miles southwest of the City of Johnstown and about two miles east of US Route 219 in Somerset County near the towns of Boswell and Jerome. The reservoir created by this dam is about five miles long and two miles wide at its widest place. Geographic coordinates of the dam are 40.1825, -78.9409. Water from flow control structures for this dam outfalls back into the lower segment of Quemahoning Creek which then empties into the larger Stonycreek River. From there the Stonycreek River continues on and flows into and through the City of Johnstown to it’s confluence with the Little Conemaugh River. It is there at/near the famous locations of the Point Stadium and the historic Stone Bridge where these rivers converge to form the Conemaugh River. I spent much of my years as a teenager and young man fishing at the “Que”. It is a jewel - a very impressive dam and a magnificent recreational lake for multiple purposes - including being a raw water source for various industries in the region and more recently for downstream controlled flow releases for whitewater rafting trips which are now organized on a very much cleaner Stonycreek River. On a more eerie note, it is said that the reservoir covers the American Indian village of Kickenapauling's Town, which was referred to in records of Colonial era Ohio River explorer and frontiersman Christopher Gist as well as record deeds of Joseph Johns. (Note: You can web search Cambria Somerset Authority for more information about the Quemahoning water supply, Stonycreek River tubing for various references related to recreational opportunities on the river, and Stonycreek-Conemaugh River Improvement Project SCRIP for watershed related conservation and stewardship activities.)

The purple dot on this map shows the location of the Quemahoning Dam in relation to the City of Johnstown to the north. The Stonycreek River is in blue color and runs from the dam in an bottom-to-top (south to north) direction. Johnstown is at the top-middle (north) part of the map. (Source: USGS National Map)
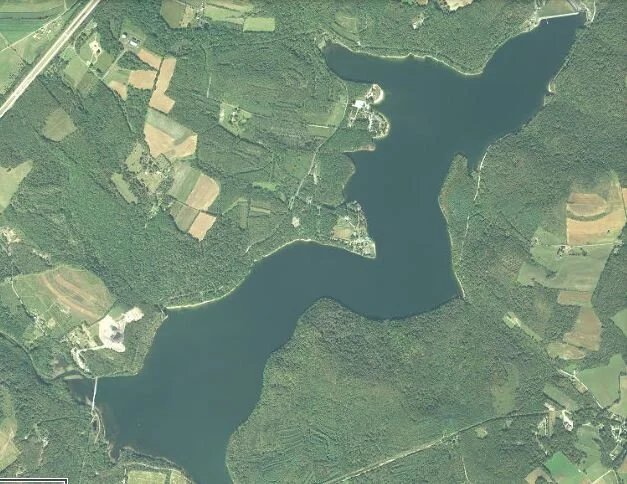
This is an aerial map showing the 850 acre plus lake/reservoir behind the Quemahoning Dam. The earthen embankment and spillway is at the top right-hand (northeast) part of the map and US Route 219 is partially visible in the upper left-hand (northwest) corner of the map. (Source: USGS National Map)
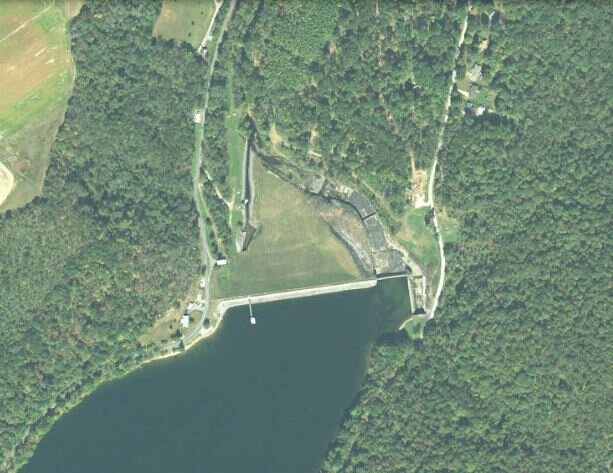
This is an aerial map close-up of the impressive dam and spillway works for the Quemahoning Dam. The earthen embankment is the triangular-shaped area just above (north) of the edge of water. The primary spillway and outlet channel is on the left (west) side and the emergency spillway is on the right (east) side of the dam embankment. (Source: USGS National Map)
HOWEVER, PLEASE DO NOT BE COMPLACENT!
The Quemahoning Dam, like the South Fork Dam, sits high above Johnstown. It’s water eventually flows into, through and beyond the City of Johnstown. This monster was constructed for raw water supply purposes for the steel mills around 1910 to 1913. Near the turn into the 20th century, there was talk of moving iron and steel plant industry operations from Johnstown to the Great Lakes region, where better quality iron ore for steel-making purposes was present. A decision was made to keep the operations in Johnstown under the general condition that improvements that were needed to be made were made to ensure a dependable water supply was available. This became the origin of the Manufacturer’s Water Company, which is a term and entity embedded in Johnstown history. Several dams were built to form impoundments (lakes/reservoirs) to do this in the region around Johnstown - including the Quemahoning and the Hinckston Run Dam which I have talked about numerous times within this website. A 66-inch diameter pipe conveys water from the Quemahoning Dam down the valley to the City of Johnstown, which is about 15 miles away depending on how you draw the line on “how the crow flies”.
The Quemahoning Dam, or “Que” as she is known, sits about 450 feet in vertical elevation difference above the City of Johnstown as compared to the South Fork Dam which was about 430 feet vertically above Johnstown. The drainage area to the “Que” is 40 more square miles (25,600 acres) than what drained into the South Fork Dam. The “Que” is a relatively short five more stream miles further from Johnstown than the South Fork Dam was. The lake surface at the “Que” is about 400 acres bigger than the lake that was impounded behind the South Fork Dam. The depth of the lake at the “Que” is about 30 feet deeper than what the depth of the lake was at the South Fork Dam. The length of dam at the “Que” is 35 feet longer than what the South Fork Dam was. The height of the dam at the “Que” is 25 feet higher than what the height of the earthen embankment was at the South Fork Dam. At a modest 12 billion gallons, the capacity of the “Que” is 7 billion gallons more than what the volume of the reservoir behind the South Fork Dam was. Yes, that is BILLIONS with a “B”.
In summary - the dam/lake for the “Que” is higher in elevation above Johnstown, is about the same distance away from Johnstown, has more drainage area to it, has a bigger lake, has deeper water depth, has a longer and higher dam, and has more capacity (water volume) than the South Fork Dam did. And it is over 100 years old.
ARE YOU GETTING THE POINT YET?
Here are some actual compiled statistics comparing the two dams. Remember the one in the left column is failed, the one in the right column still stands.
Comparison between the Quemahoning and South Fork Dams
〰️
Comparison between the Quemahoning and South Fork Dams 〰️

If the “Que” would break like the South Fork Dam did, the dam break inundation zone would be on/along the Stonycreek River into, through and beyond the City of Johnstown. A wall of water would come barreling through Johnstown from the south - in a catastrophic and devastating manner very similar to that which occurred during the famous 1889 flood and dam failure. Because of the statistics shown above, perhaps even worse. Only this time there are more people, there is more development, there are more buildings, there is more infrastructure, and there is much less awareness (complacency) present due to the great span of time which has occurred since the famous dam breaks of 1889 and 1977. Also, much of the Little Conemaugh River valley in the northeast part of town in 1889 was industrial in nature (Conemaugh, Woodvale) when the wall of water and debris came through from the breach of the South Fork Dam. For the Stonycreek River, much of the valley in the southwest part of town is suburban and business in nature (Benscreek, Ferndale, Moxham, Hornerstown, downtown) with much higher population compared to 1889.

The emergency (auxiliary) spillway of the Quemahoning Dam (September 2024).
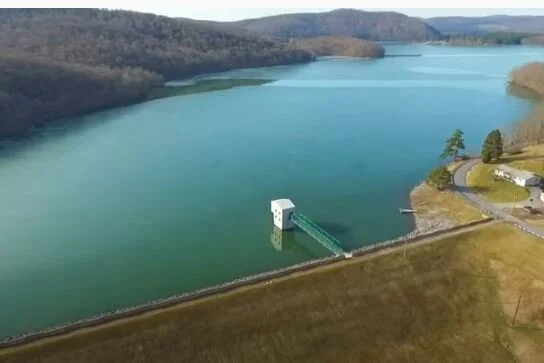
Aerial view of the principal flow control spillway and earthen embankment (dam breast) of the Quemahoning Dam in Somerset County, PA (Source: YouTube, date 2016).

The emergency (auxiliary) spillway in action at the Quemahoning Dam (Source: WJAC April 3, 2024).
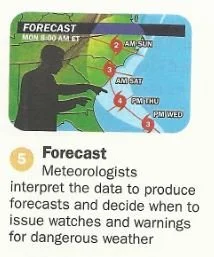
However, there is good news. There are much better dam safety programs and protocols in place now for such regulated impounding structures (dams). Actually, many of the modern day dam safety programs and performance requirements for dams across the nation came to be because of the history of dam breaks that affected Johnstown. Although much better regulated, you must never forget though that this MONSTER dam still sits above Johnstown. Always take the time to stay aware of rapidly changing conditions associated with the weather, especially heavy rainfall watches and warnings, statements from emergency management agencies, or any other conditions that could occur and affect the function and structural integrity of the Quemahoning Dam. In the dam safety world, there is a term called “sunny day” breach which means that a dam failure could occur under certain circumstances that does not involve rain, snow, rainstorms, storms or precipitation events.
Dams are meant to handle very large flows (runoff) from storms. They are designed to safety pass water through, over or around the dam from very large precipitation events that are physically possible (probable maximum) based on regional meteorological conditions. Passing of the water is supposed to result in no or little damage to the structure or flow control components of the dam. Or if some damage occurs, it can be fixed quickly so that the dam stands ready for the next event.
However, besides precipitation, other things can affect dams. These include, but are not limited to, lack of maintenance, droughts, earthquakes, soil slope failures, agricultural and forestry activities and/or other large changes in land cover within the watershed, wildfires, nuisance animals, mudslides in the area around the lake shoreline, and acts of vandalism or terrorism. Contrary to public opinion, trees and woody vegetation on engineered and compacted “earthen” dam embankments are NOT good to control erosion and the presence of trees and woody vegetation on dams is one of the leading causes of dam failures in the nation. This is because trees can blow over from wind during storm events or they can fall over because of saturated soil conditions from storms and/or if the dam overtops and water flows down the face of the dam. When trees fall, the roots lift out of the soil causing a hole. When water flows across this hole, it can scour quickly into the soils of the dam and start the failure process. Even if the trees do not fall over, tree root penetration can damage compacted soils of the dam or create water flow paths (seepage) internally within the dam which can quickly move soil in the dam and lead to dam failure. This is called “internal soil erosion” or “piping”. Many times, the types of conditions as described above, which may seem harmless individually can work in tandem and can accelerate to dam failure conditions very quickly.
Because the Quemahoning Dam is a large sized dam with considerable dam height and capacity, it is dam is regulated by the dam safety program of the Commonwealth of Pennsylvania. For more information about this visit: http://www.scema.org/wp-content/uploads/2017/05/Dam-Safety-Fact-Sheet.pdf
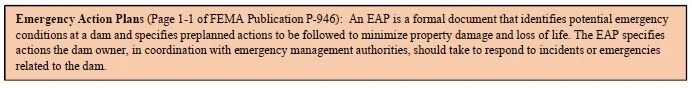
Because it is a regulated impounding structure, there would be distinct EMERGENCY ACTION PLAN tasks formulated for this dam. An emergency action plan or EAP outlines items, actions, steps and responsibilities to take to monitor rainfall and flows through or over the dam, watch lake levels, inspect the dam and it’s important features, observe structural conditions of the dam embankment and/or take physical steps to repair the dam in an emergency manner with soil, rock, pipes or in some cases pumps/pumping. The plan would have distinct stage notifications and actions that must be performed to and by different entities such as the dam owner, engineers, contractors, local government, and/or emergency management officials if threatening conditions arose or if it looked as if the dam has potential to overflow or breach. This includes notifications to the public, PENNDOT, police and fire, emergency management, county and township officials, and state dam safety program representatives. Road closures and downstream evacuations may be necessary. Responsible persons would not wait until the dam broke to take such action as time would be of the essence. These actions are evident and happen along the way by certain triggers as conditions become apparent, are observed, start to happen, continue, worsen, or compound.
So please stay aware always about this dam and stay safe!!
FOR FLOOD MONITORING SEE BELOW
Emergency Action Plans for Dams
~
Emergency Action Plans for Dams ~


Flood Monitoring
~
Flood Monitoring ~
FLOOD MONITORING
Different from coastal flooding, flooding from rivers and streams is called riverine flooding. Most streams and rivers that flood are regulated in some manner as Special Flood Hazard Areas (SFHA’s) under the nation’s National Flood Insurance Program (NFIP). This program is administered by the Federal Emergency Management Agency (FEMA) and other state, regional, and local agencies. For more information about FEMA, flood hazards, flood insurance, flood insurance studies (FIS) and flood insurance rate maps (FIRMS), you can visit: https://www.fema.gov/flood-insurance or https://www.ready.gov/floods
The United States Geological Survey (USGS) https://www.usgs.gov/ monitors data from over a million surface water, groundwater, water-quality, and water-use sites across the country. They have awesome tools to use whether you are an engineer, a scientist, a student, a weather enthusiast, an interested citizen, or a stormwater “geek” like me. The USGS Water Resources section has a National Water Information System where you can use their website resources to look at any of these stations. You can actually access rainfall, flow (discharge), water levels (gauge heights), and other great information. You can set up a “water alert” to receive a text or email at any selected flow or gauge height that you want for most of the sites. Monitoring data at this station is a good way to get a handle on being alert to “rapidly changing conditions” as mentioned in the section above that discusses dangers associated with the Quemahoning Dam.
There is a USGS gauging station on the Conemaugh River at the 4th Street Bridge in the Minersville, Cambria City section of the City of Johnstown near Iron Street. This is very near to the location in my website where I show the Hinckston Run stream confluence with the Conemaugh River. The name of the station is: USGS 03041029 Conemaugh River at Minersville PA

The website link for this USGS monitoring station is at:
https://waterdata.usgs.gov/monitoring-location/03041029/#parameterCode=00065&period=P7D
The website link for USGS flood information (WaterWatch, Flood Alerts, WaterAlert, WaterNow, etc.) is:
As I developed this portion of my website, these were the current (random) statistics for the Conemaugh River at this station. The gauge height for the river read 3.36 feet and the flow rate was 1,070 cubic feet per second (cfs). Incidentally, one cubic foot per second (cfs) is equivalent to a flow of about 450 gallons per minute. Therefore, a flow rate of 1,070 cubic feet per second is equivalent to 480,430 gallon per minute or 691.8 million gallons per day (MGD). The website shows the triggers for river flooding at this location as follows: flood stage is at 28 feet; moderate flood stage is at 30 feet; and major flood stage is at 34 feet. There is an “action” stage set at 23 feet which I suppose means when National Weather Service flood warning notifications are issued or when things really “start to get serious”.
As my Dad used to live at the bottom of Iron Street in Minersville, I used to always remind him that he was in a defined Special Flood Hazard Area associated with the Conemaugh River and also potentially in the dam break inundation zone of both the Hinckston Run and the Quemahoning Dams. I had set up a “nifty” alert through the USGS water alert system to get an email when the stage in the river (gauge height) reached 24 feet or 1 foot above the action stage mentioned above. It was in that way that I could tell him that the river was rising quickly and he should “run for the hills” and go up on Benshoff Hill to visit his relatives or friends to stay safe - ie. get the heck out of Minersville. Plus if the river was getting up to a level this high from the nearly 680 square miles that drains to the Conemaugh River at this location, then I would have really started to become very worried about the “monster” dam that I talked about in the section above.
Below is some basic information about this USGS station from the website for Station No. 03041029:
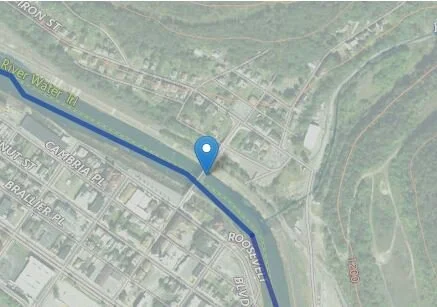
Aerial map showing the location of USGS Station 03041029 at the Conemaugh River in Minersville in the Cambria City section of the City of Johnstown

Photograph of USGS Station 03041029 on the 4th Street bridge

Basic information about USGS Station 03041029
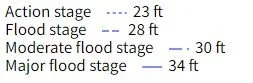
Gage heights to watch out for at USGS Station 03041029

This is more detailed information about USGS Station 03041029
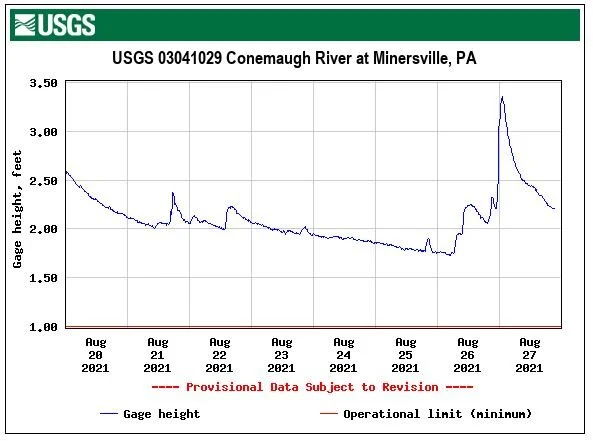
GAGE HEIGHT - Sample of a graph showing gauge height in feet (left side) versus date (bottom) for USGS Station 03041029. Gauge height of the river was 3.36 feet on the date this data was obtained on August 27, 2021
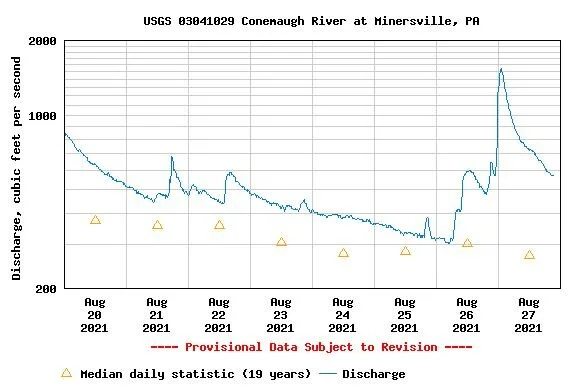
FLOW/DISCHARGE - Sample of a graph showing discharge/flow rate in cubic feet per second (left side) versus date (bottom) for USGS Station 03041029. Flow rate in the river was 1,070 cubic feet per second on the date this data was obtained on August 27, 2021
Just to finish up discussion about FLOOD MONITORING and some of the tools available from USGS, I will give you some perspective on the concept of flow/discharge as it pertains to the above graph. As stated previously and as shown in the graph, the flow in the river was at 1,070 cubic feet per second (cfs) on the date I retrieved the data from USGS Station 03041029. This was the flow rate of the river on a randomly selected “normal day”. The following table shows approximate design flows (ie. river capacity) and peak estimated flows of the Conemaugh River during the 1977 Johnstown Flood. This number - at 120,000 cubic feet per second - is over 100 times the amount of the normal flow of the river. Again as one cubic foot per second (cfs) is equivalent to a flow of about 450 gallons per minute, then a flow rate of 120,000 cubic feet per second is equivalent to 53.8 million gallons per minute or 77 BILLION gallons per day (MGD).
Below the table that shows the flows, are recorded rainfall amounts that occurred across the Greater Johnstown region during the 24-hour period on/around July 20, 1977. These are the rainfall amounts that caused that river flow, river flooding, and the Laurel Run dam break. Below that table are links to two sites to access forecasted or observed rainfall data by tools offered by the National Oceanic and Atmospheric Administration (NOAA) and the National Weather Service (NWS).


Source: USGS publication about the 1977 Johnstown Flood.
To view and obtain forecasted or observed rainfall data, visit the National Oceanic and Atmospheric Agency (NOAA) - National Weather Service (NWS), Advanced Hydrologic Prediction Service (AHPS) website at: https://water.weather.gov/precip/# and the Community Collaborative Hail Rain and Snow Network (CoCoRaHS) at: https://www.cocorahs.org/
Note: Conversion equivalents related to the above discussions are as follows:
Area - as in the area of a lake or the contributing watershed area that drains to a lake
1 square mile (sq. mi.) = 640 acres (ac.)
1 acre (ac.) = 43,560 square feet (sq. ft.)
Length - as in the distance between two points
1 mile (mi.) = 5,280 feet (ft.)
Volume - as in the volume or maximum impounding capacity of a lake
1 cubic foot (cf) = 7.48 gallons
1 acre-foot (ac.-ft.) = 43,560 cubic feet (cf)
1 acre-foot (ac.-ft.) = 325,851 gallons
Weight - as in how much something weighs on a scale
1 gallon of water (gal.) = 8.34 pounds (lbs.)
1 cubic foot of water (cf) = 62.4 pounds (lbs.) at 32 degrees Fahrenheit
Flow Rate - as in the rate by which water moves in a waterway or man-made conveyance like a pipe
1 cubic foot per second (cfs) = 449 gallon per minute (gpm)
1 cubic foot = 7.48 gallons
1 million gallons per day (MGD) = 1.55 cubic feet per second (cfs) = 694.4 gallon per minute (gpm)